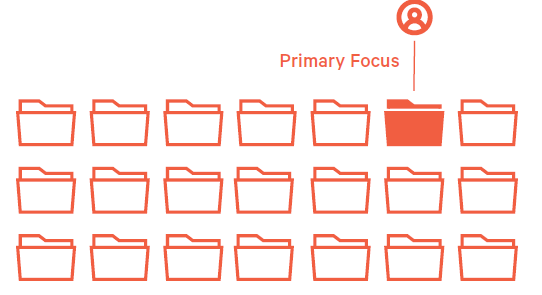
1.Domain champion
-
- How to recognize it:
-
-
- Read from refactor and churn metrics , always work at same code work directory, knows every class every method
- Very little actionable items can be provided by peer code reviewer
- How to act to correct
- Ask them what they like to work with
- have 1:1 to raise challenge them to take on other tasks outside their comfort zone
- Acknowledge their expertise encourge to share expertise with others, ask them what candidate they think appropriate to share.
-
2. Hoarding the code
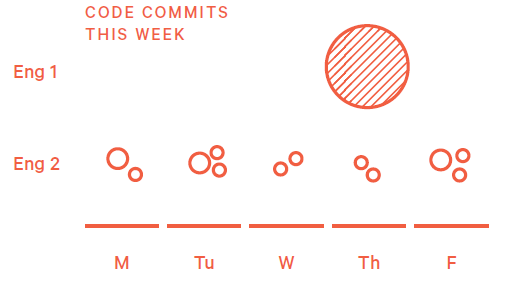
This pattern refers to the work behavior of repeatedly working privately and hoarding all work in progress to deliver one giant pull request at the end of the sprint.
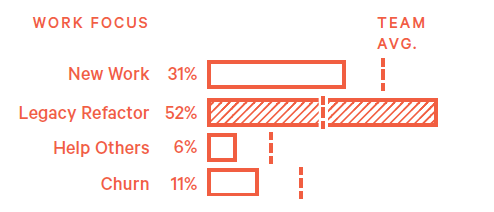
3. High churn
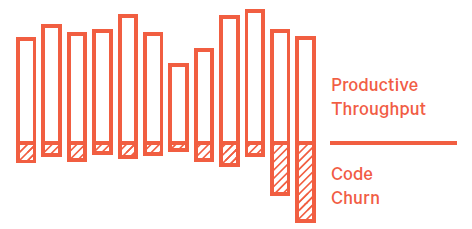
Code churn is understandable at a rate of 15-30% of LOC committed, but if it is above that range that will impact the efficiency and productivity.
- What to do:
- Understand if it external factor - late arrival requirement from PLM, step in to show this data to stakeholders to manage the addition of requirement
- Internal factor - developer's perfectionism that adds no value to the functionality, ask a more senior developer help to evaluate whether its neccesary.
Heroring:
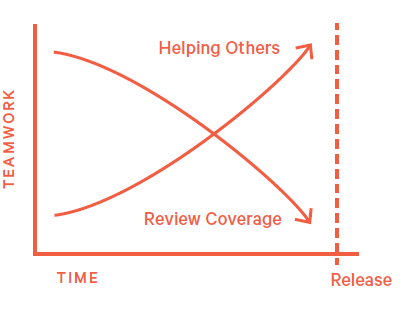
- How to recognize:
Find some critical defect right before Release to save the day fix other peoples work at the last minute.
- What to do;
Asking team members to make s'more And frequent commits commits and request interim review rubber band holding the bulk of changes until the last minute.
Clean as you go
- Showing a virtue that the pole base that's continuously involving an engineer contributes new code and also into a adjacent code.
- What to do
Recognize the engineers work publicly and use it as a model for other team members to work towards
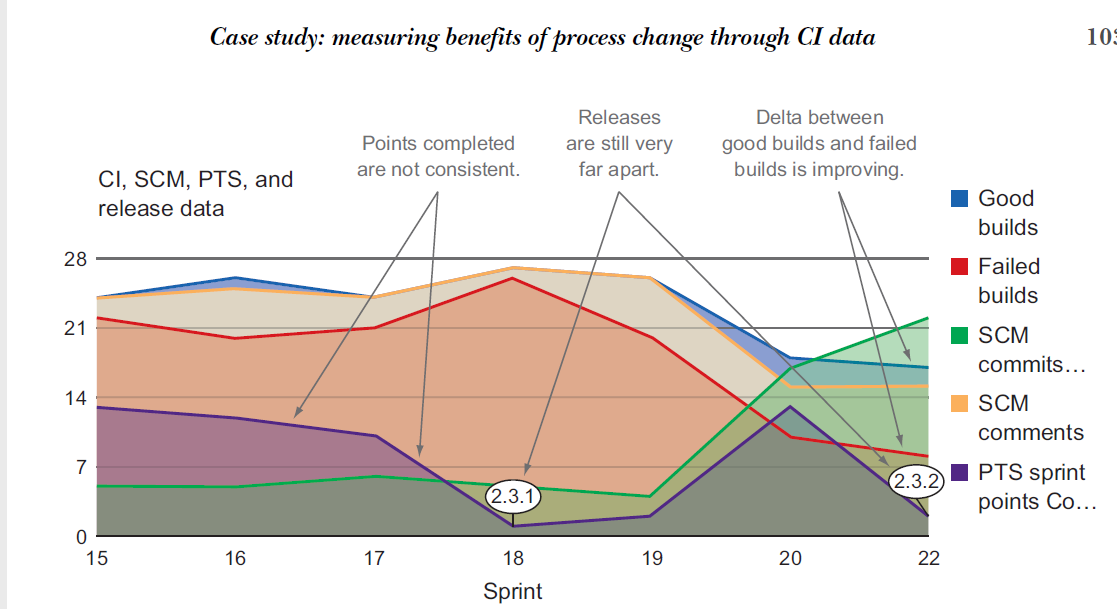
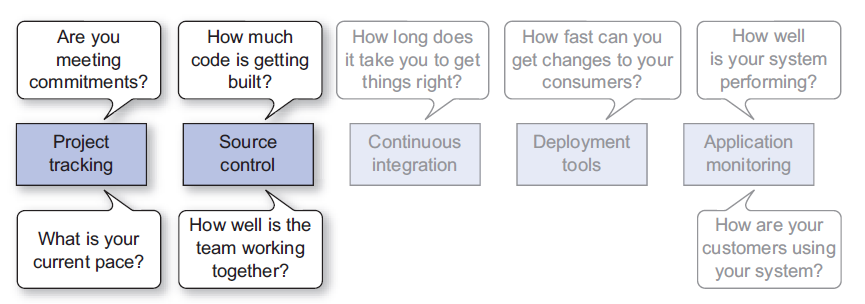
Project Tracking System - Are you meeting your commitment?
Total done vs Planned done
Velocity
Bugs, Recidivism Rate(reopen rate) - Ideally all effort should be devoted to code that represent business value, bug fixes are not
Monitor how many must fixed bugs that disrupt the value chain deliverery
MTTR - Meantime to repair How quick we can get a bug fixed, represent team's familiarity of code, efficiency of automation test
Make these metric visible via dashboard
Source Control - How well is the team work together
Source control is where your code is being written and reviewed and is a great source to complement PTS data for better insight into how your team is operating. Using the pull request workflow and distributed version control can give you a lot more data than non-distributed SCMs. Often web-based DVCS systems, like GitHub, will have
built-in charts and graphs you can use to get a picture of how your team is using them.
■ Teams use source control management to manage their codebase.
■ Here are some things you can learn from SCM data alone:
■ Who is changing the code?
■ How much change is happening in the codebase?
■ Here are some questions you can answer with just SCM data:
■ Who is working on what?
■ Who is helping whom?
■ How much effort is going into the work?
■ Use pull requests with DVCS to obtain the richest data out of your SCM.
■ Look for these key trends from SCM:
■ Relationship between pull requests, commits, and comments.
■ Denied pull requests versus merged pull requests.
■ CLOC over time.
■ SCM data against PTS data to see how they affect each other.
■ DVCSs are superior to centralized ones for a variety of reasons:
■ They provide much richer data than centralized SCM systems.
■ They can improve the development process by using recommended flows.
■ They tend to have RESTful APIs for easier data collecting.
■ Pull requests combined with comments and code reviews add another dimension to the team’s collaborative process.
■ GitHub with its Pulse and Graph tabs contains a lot of useful information about the health of the project.
■ Visualization techniques are available for centralized VCS through commercial products.
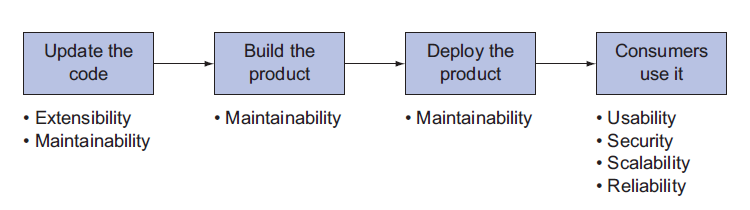
Post Release metrics - Measure product quality in real time (Page 179)
Maintainablity / Extensibility - How easy is it to add features and product deployment
Reliability / Availability - How much percentage of uptime, and how much percentage that service are provided according to required time limit
You could have an application that is up all the time (highly available) but doesn’t
function correctly 50% of the time (low reliability). You could also have an application
that does what it’s supposed to do all the time (highly reliable) but is down for maintenance
for an hour a day (low availability).
Security
Usability
Page 126